Active Adult Market Data
Built for Underwriting and Site Selection
If you’ve looked at an Active Adult deal recently, you’ve probably run into this:
There isn’t a clean comp set.
- Multifamily rents don’t reflect age-restricted dynamics.
- Independent Living data assumes services that don’t apply.
- National Active Adult reports don’t help when you’re evaluating one site in one submarket.
That makes underwriting harder to defend in capital conversations.
NIC MAP gives you localized rent, occupancy, and inventory visibility for 900+ Active Adult rental communities, so you can evaluate markets using real benchmarks instead of stand-ins.
See What’s Really Happening in the Active Adult Market You Care About
Instead of relying on high-level averages, you can:
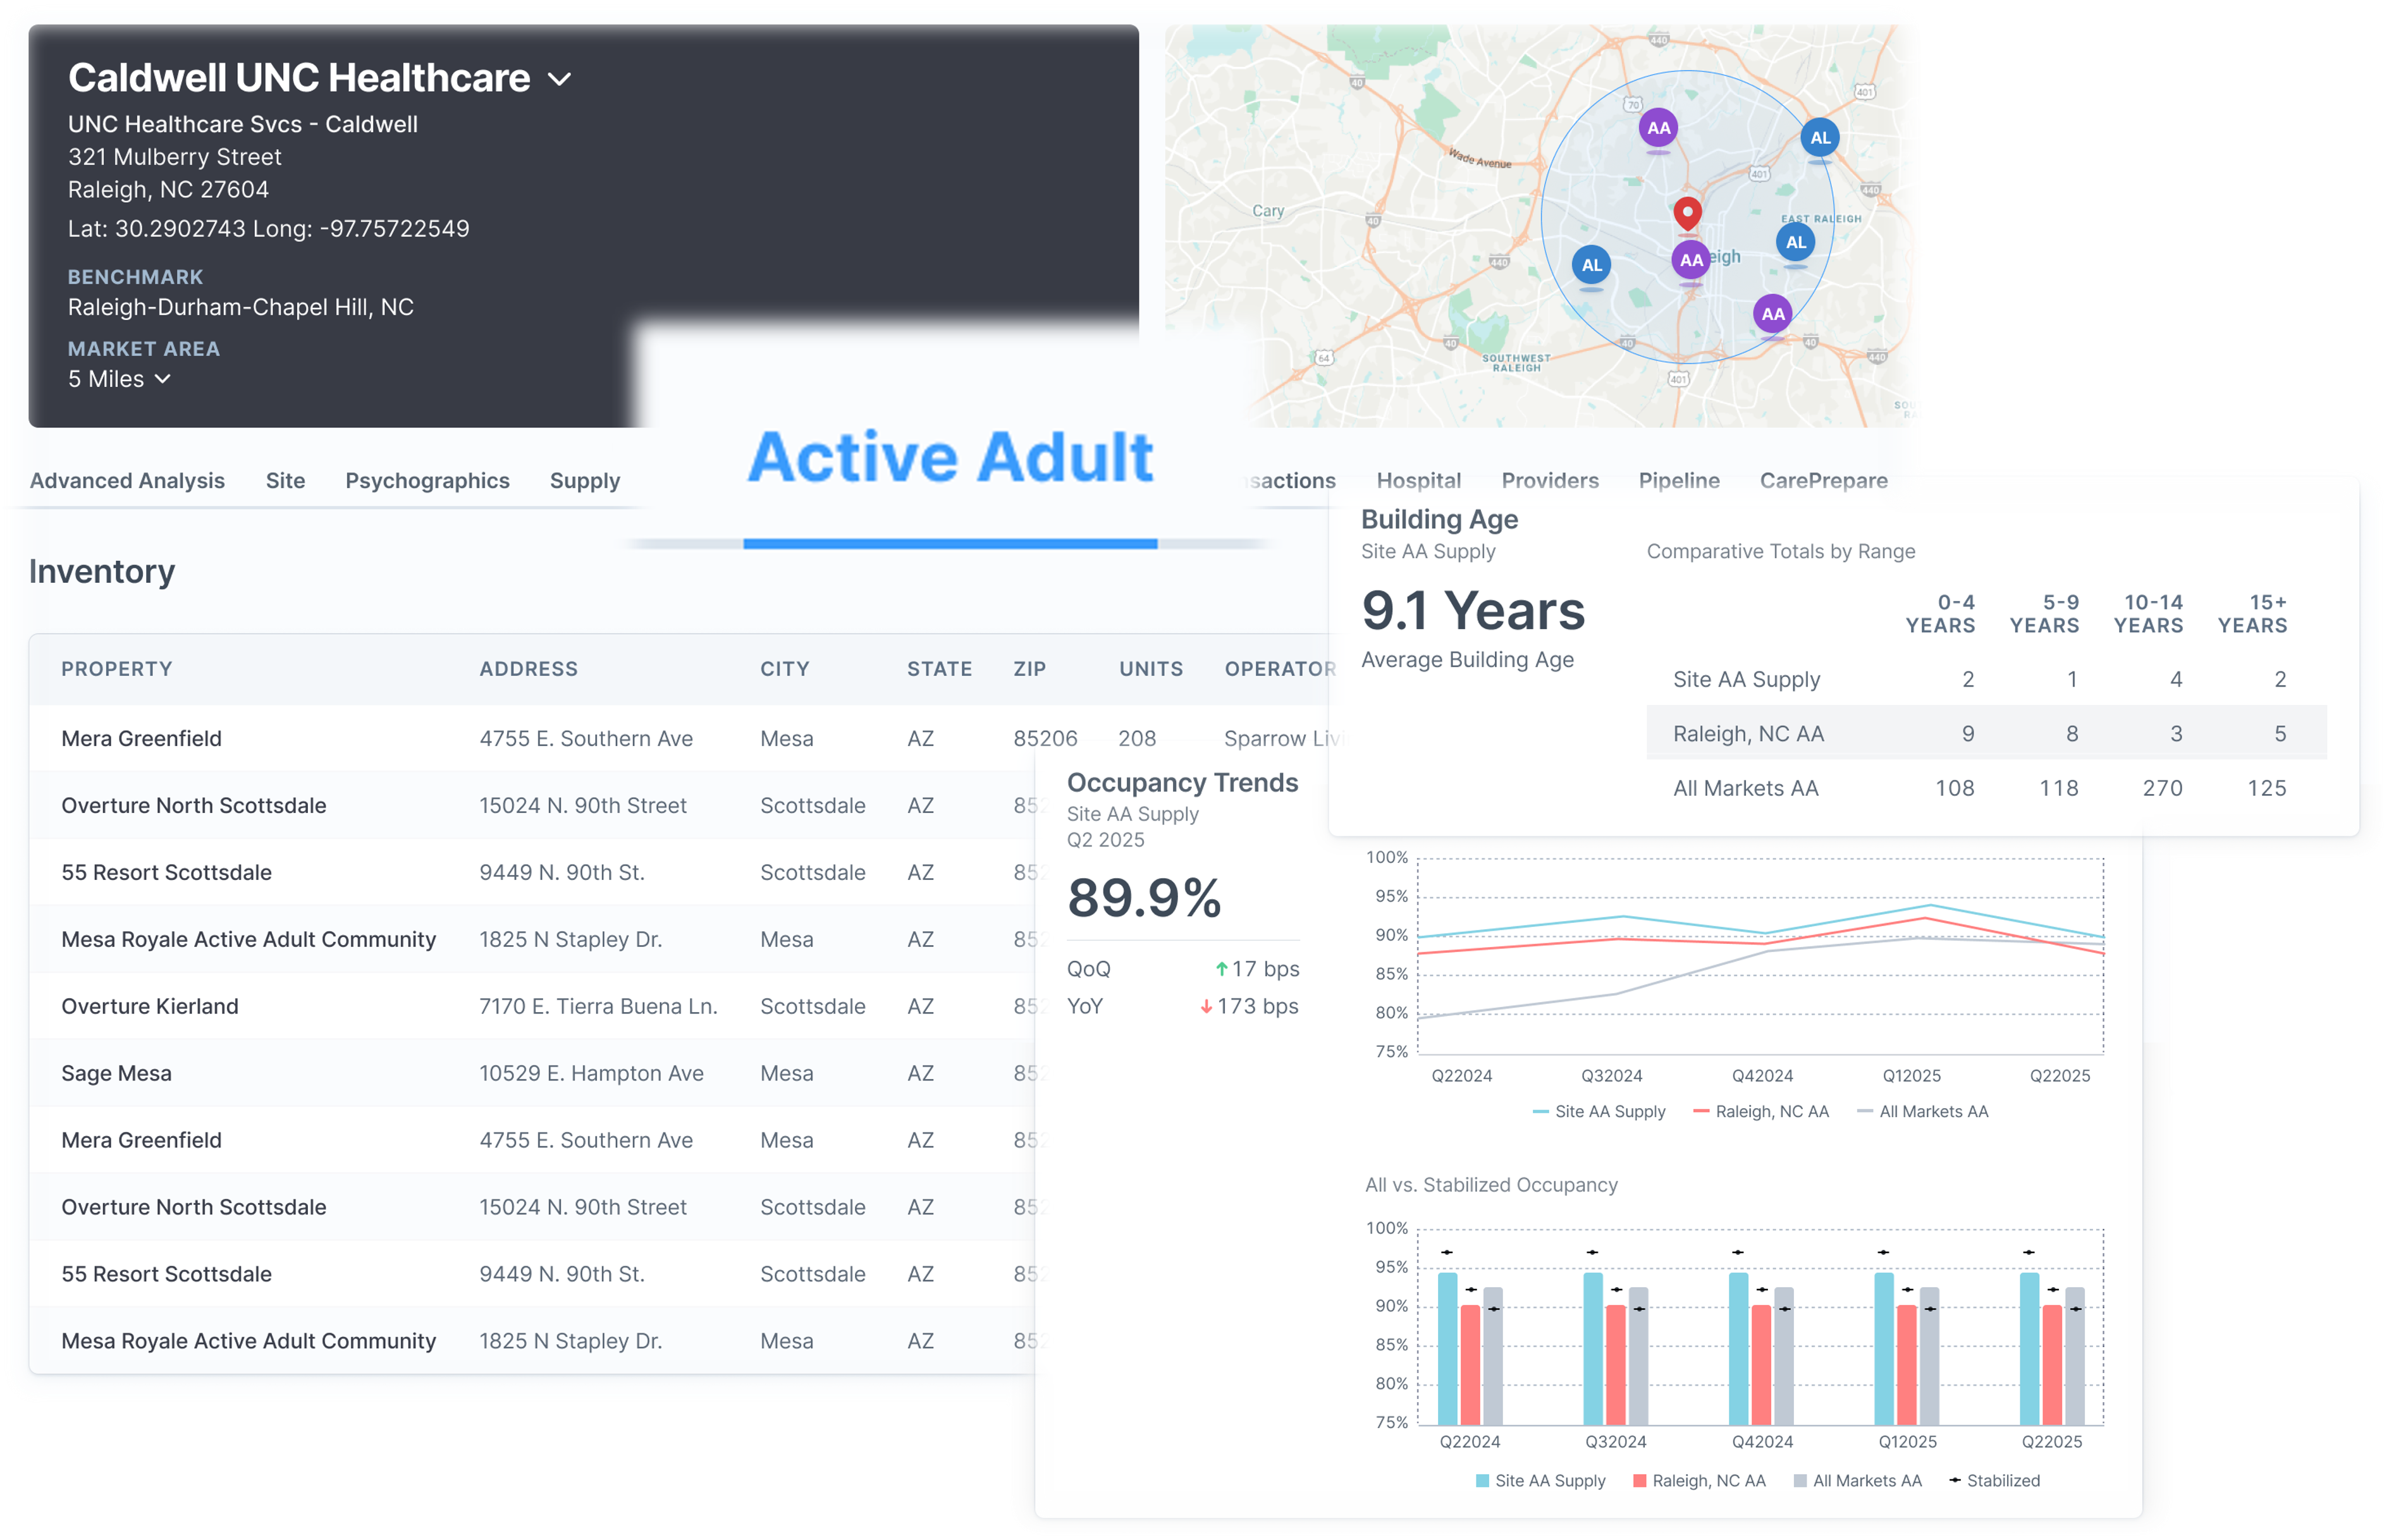
- Identify the Active Adult rental communities operating in a specific market or submarket
- See unit counts and operator concentration
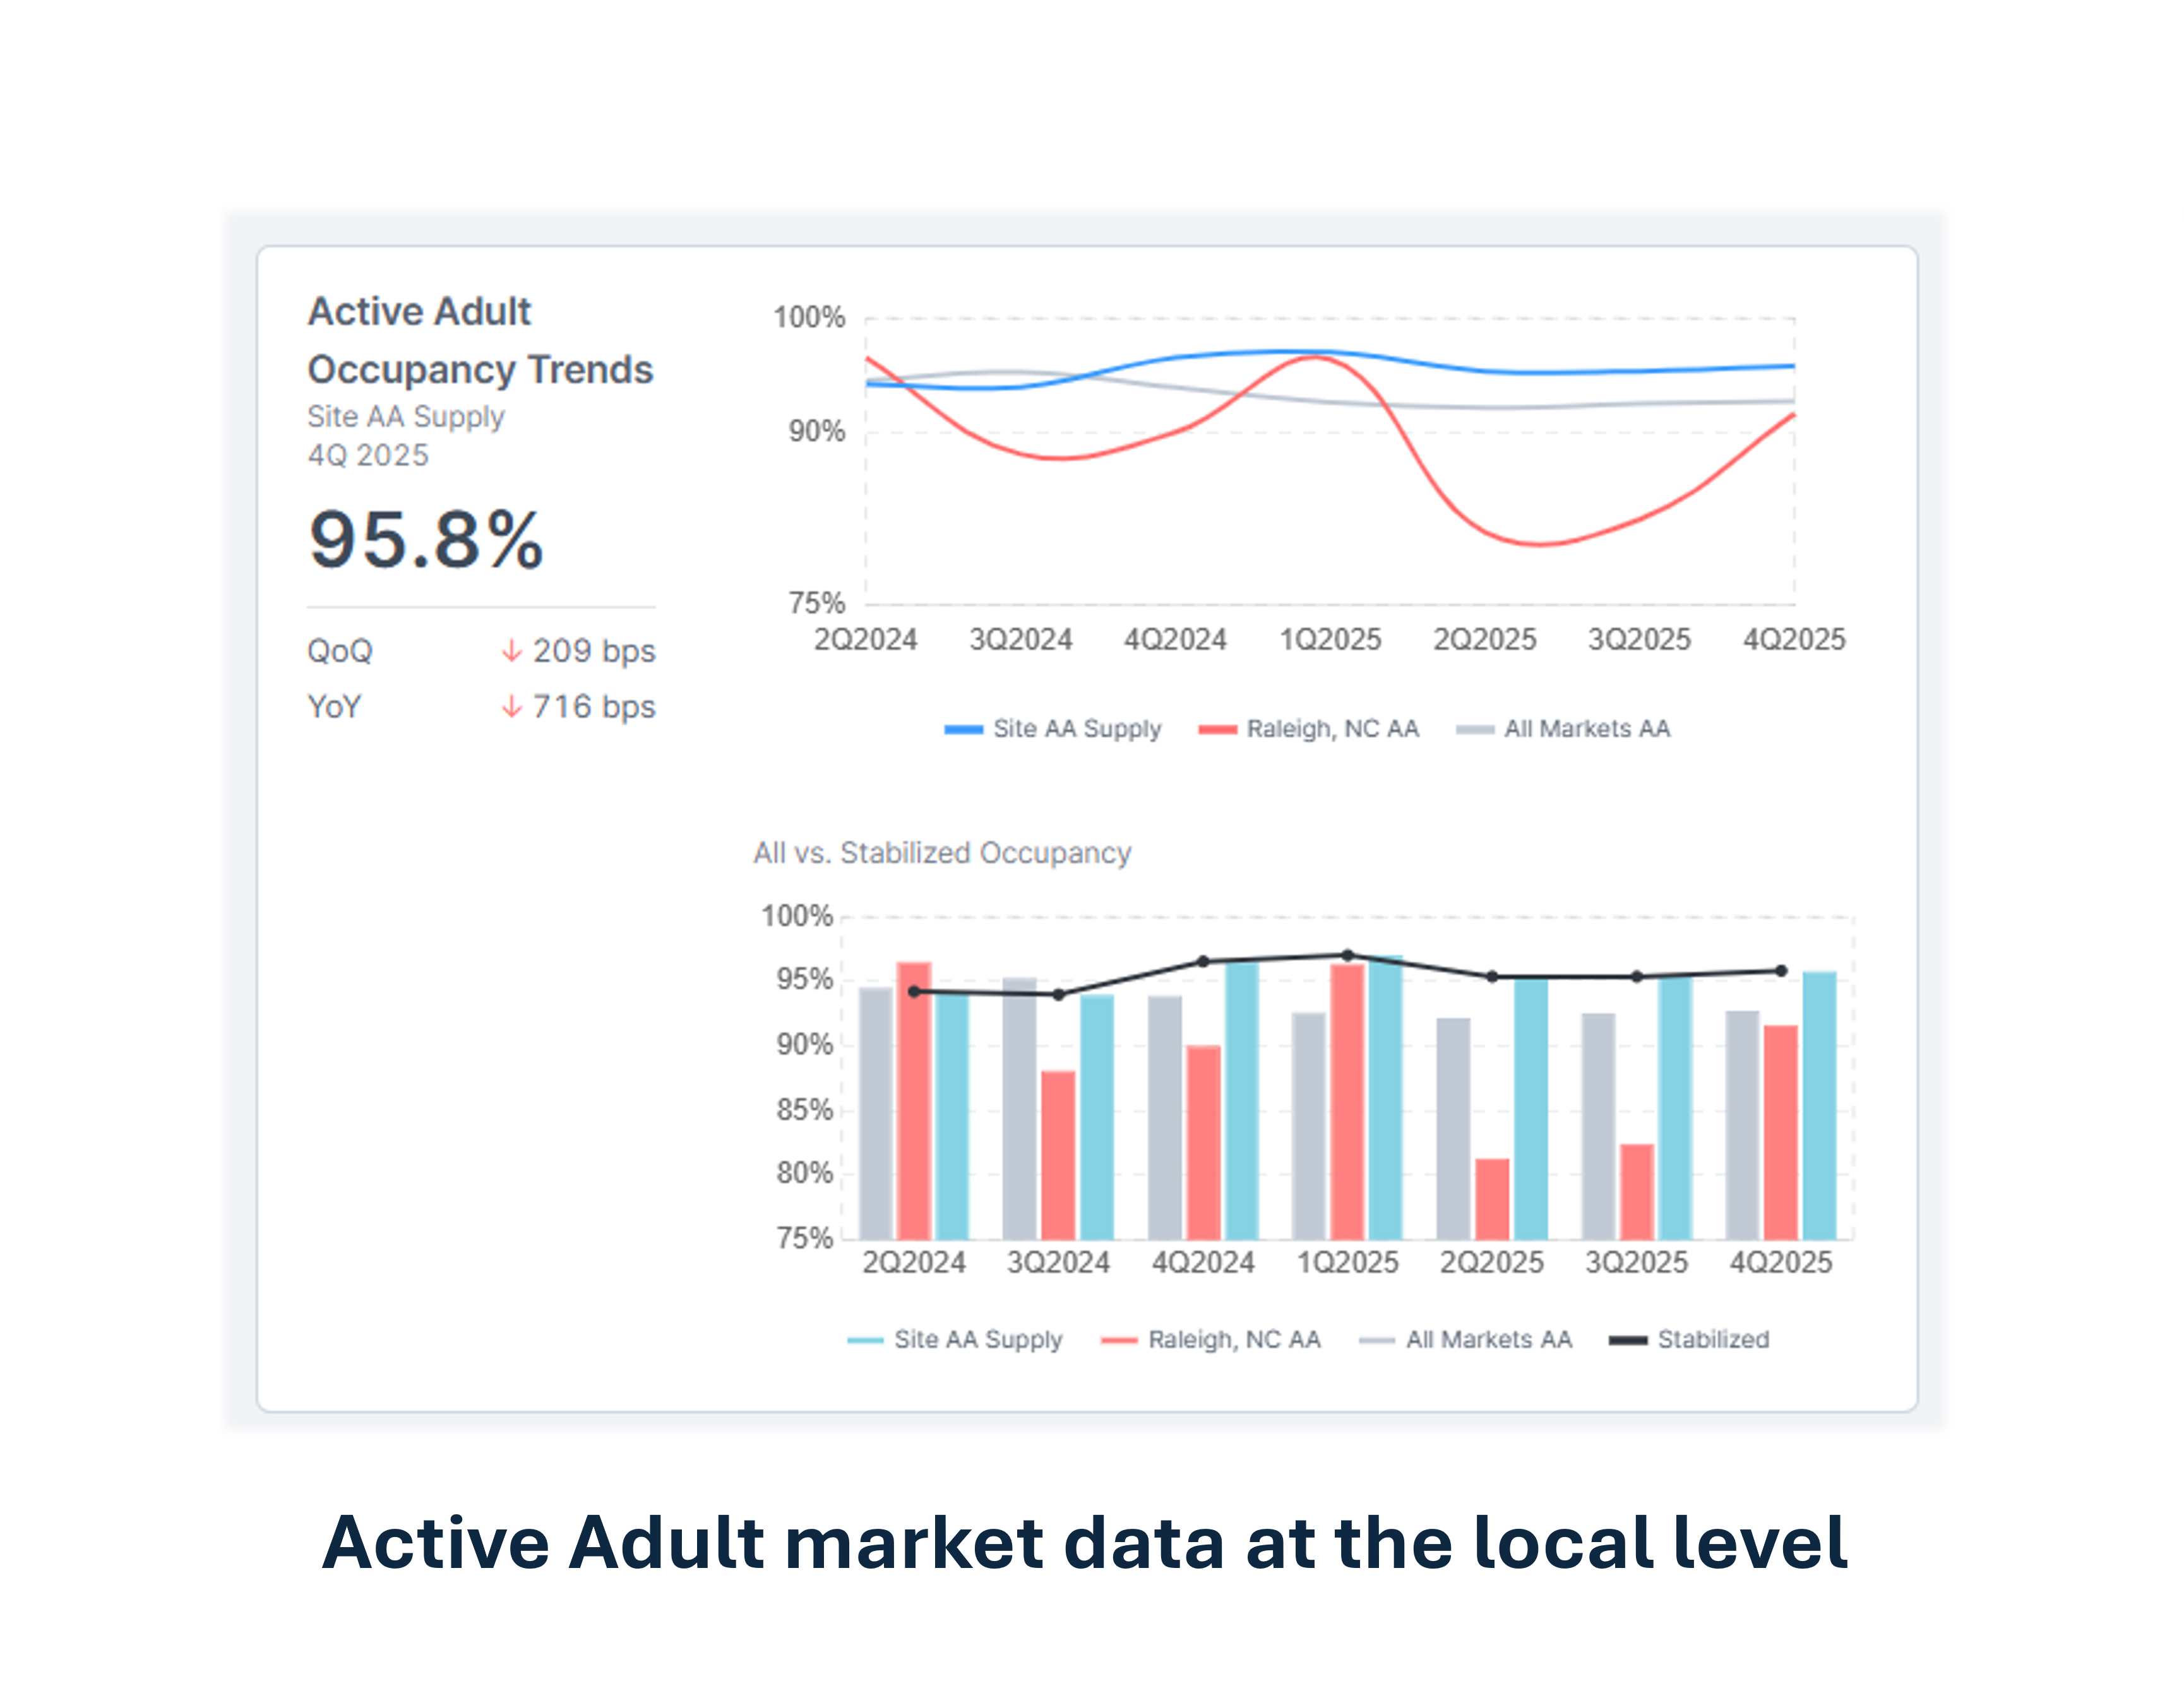
- Benchmark market-level occupancy and rent
- Compare Active Adult performance to Independent Living in the same geography
This isn’t a national snapshot. It’s localized performance context tied to the communities that market.
WHAT YOU CAN DO WITH NIC MAP

Build accurate lists for territories, regions, or national accounts
See which buildings roll up under which operator
Prioritize communities 100–200+ units
Time outreach around development and ownership changes
Identify operator leaders who influence dining, purchasing, and operations
Give reps the clarity they need to call the right buildings first
Lorem ipsum dolor sit amet, consectetur adipiscing elit. Phasellus quis faucibus elit.
Lorem ipsum dolor sit amet, consectetur adipiscing elit. Phasellus quis faucibus elit.
Lorem ipsum dolor sit amet, consectetur adipiscing elit. Phasellus quis faucibus elit.
Lorem ipsum dolor sit amet, consectetur adipiscing elit. Phasellus quis faucibus elit.
NIC MAP is the premier provider of unbiased national and local market data for the senior housing and care sector, trusted by more than 5000 customers and 30 of the 50 largest owners and operators.
Whether you’re an operator, investor, capital provider, consultant, broker, financial intermediary, developer, or third-party vendor, NIC MAP enables you to rapidly analyze any market, site, portfolio, or community.
Learn more about how our subscription service offerings can help support your business and save you time in an increasingly competitive market.
Bring Credible Context into Feasibility and Investor Discussions
Active Adult often sits between multifamily and Independent Living. That ambiguity makes it attractive — and harder to underwrite.
With localized benchmarks, you can:
- Pressure-test stabilized occupancy assumptions
- Ground rent expectations in current market context
- Show where Active Adult sits relative to IL in the same market
Plus, you can export data to use in your underwriting models, internal memos, or investor decks.
WHAT YOU CAN DO WITH NIC MAP
Step 1 — Target
Filter your territory by building size, care mix, and operator footprint to see which communities justify your time.
Step 2 — Prioritize
Sort by operator influence and recent moves — like new developments, expansions, or ownership changes.
Step 3 — Act
Export vetted lists and get them to the field immediately so reps walk into calls aligned with real opportunities.
Evaluate Supply Before You Commit Capital
One of the biggest questions we hear:
“How saturated is this market, really?”
With NIC MAP’s Active Adult data, you can:
- See existing Active Adult rental communities by address, operator, and unit count
- Identify planned and under-construction projects
- Understand who the dominant players are in each market
More than 900 Active Adult communities are tracked across 30+ major metros, with quarterly updates as coverage deepens.
It’s not anecdotal. It’s visible.
WHY FOOD SERVICE VENDORS USE NIC MAP
Foodservice teams who win in senior living:
- know which buildings matter,
- understand the operator behind them,
- reach operator decision-makers sooner, and
- aren’t surprised by new builds or ownership changes.
Many vendors already run their territories with NIC MAP.
Calling blind puts reps at a disadvantage.
20+ years
of senior housing data
35,000+
properties tracked
1B+
demographic & demand data points
 |

Using NIC MAP for vendor outreach changed our workflow — we focused reps only on the buildings that could actually support our program.

Foodservice Sales Leader
See How Active Adult Is Performing in Your Target Market
If you’re evaluating a new site, screening a deal, or revisiting an opportunity you previously passed on, we’ll walk through:
- Local inventory and operator concentration
- Market-level rent and occupancy benchmarks
- How Active Adult compares to IL in that geography